|
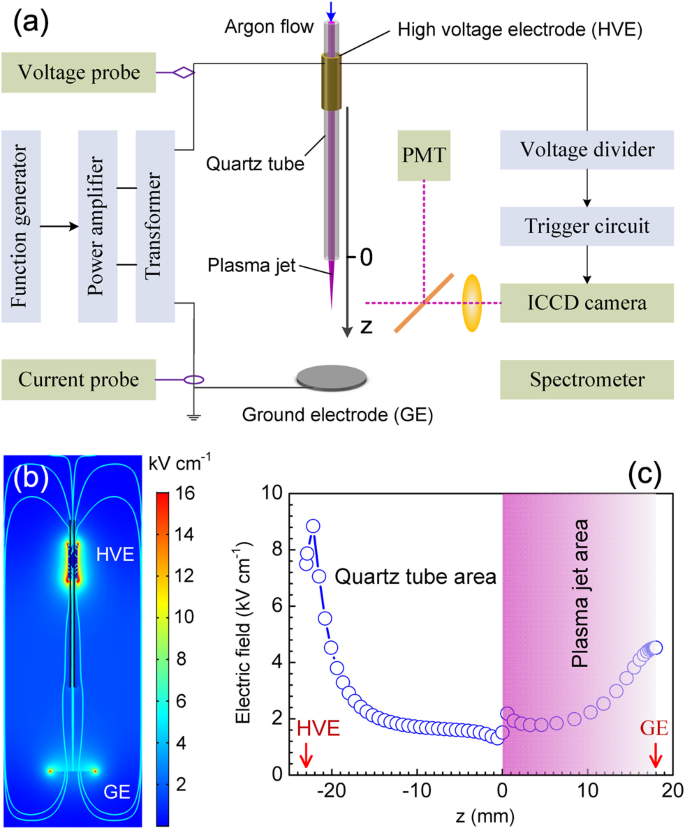
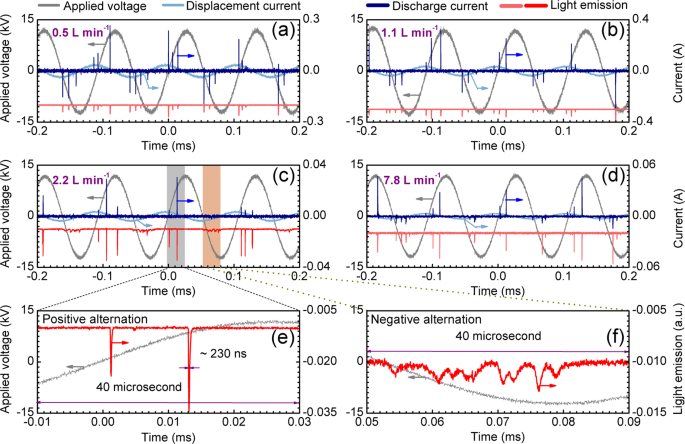
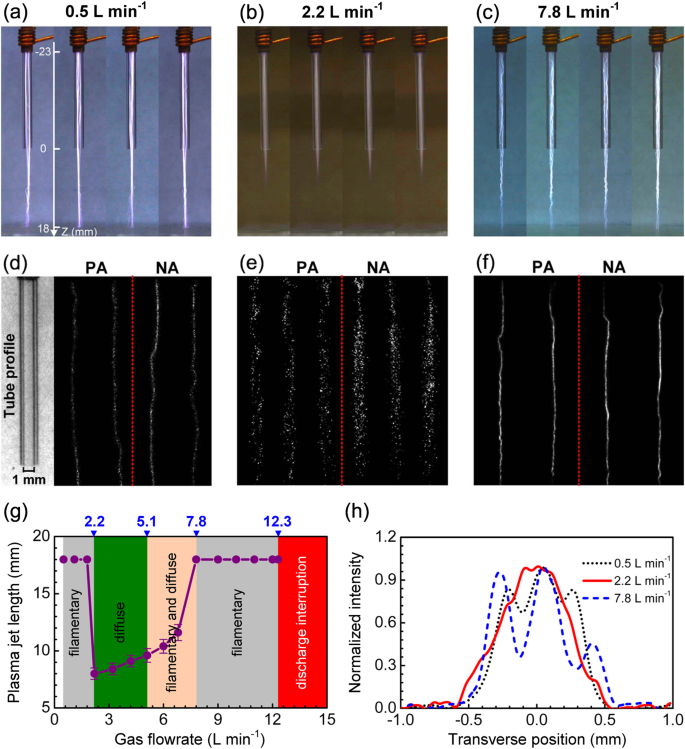
Electrical and optical emission characteristicsElectrical and optical emission characteristicsFigure 1a shows the experiment was performed in a cylindrical DBD system. The feeding gas argon (99.999%) flows into a thin quartz tube from the upper inlet (indicating by the blue arrow), ejects out of the tube from the nozzle, and rushes toward the ground electrode (GE). When the applied voltage increases to a certain value, there occurs the gas breakdown between the high-voltage electrode (HVE) and GE. The plasma jet pattern (filament or diffusion) is controlled by adjusting the gas flow. Figure 1b shows the electrostatic field pattern associated with the cylindrical DBD, which was calculated by solving the Laplacian equation in an axisymmetric cylindrical coordinate (r–z). The geometry configuration and material properties in the numerical simulation are the same as those in the experiment. The relative permittivity of quartz tube is set as 3.7. We modeled the field distribution by imposing a potential of 11 kV between the two electrodes without discharge. The potential value approximately equals the amplitude of the sinusoidal alternating high voltage applied in the experiment. It is clearly seen that the electric field between the electrodes is parallel with the tube axis and the discharge occurs in a linear field (rather than a cross-field), in which the charged particles drift along or against the gas flow. The distribution of electric field along the quartz tube axis is shown in Fig. 1c. It is found that the electric field presents a small rise near the HVE and reaches its maximum of 8.8 kV cm−1 at z = −22 mm. After a sharp drop and a slow decrease through the quartz tube, the electric field arrives at the minimum of 1.3 kV cm−1 at the nozzle (z = 0). Following a fluctuation due to the rapid permittivity variation on the nozzle end face, the electric field decreases slowly and reaches its local minimum at z = 4 mm in the open air. Finally, the field increases again and reaches its local maximum of 4.5 kV cm−1 at the GE. a Schematic diagram of the experimental setup. The gas flow is indicated by the blue arrow. The plasma jet extends along the z-axis. HVE, GE, PMT, and ICCD mean the high-voltage electrode, ground electrode, photomultiplier tube, and intensified charge-coupled device, respectively. b The electrostatic field pattern of the cylindrical dielectric-barrier discharge (DBD), modeled by imposing a potential 11 kV between the electrodes. The relative permittivity of quartz tube is set as 3.7. c The distribution of electric field along the central axis of the quartz tube. The blue circles are the simulation data of electric field. The position of HVE and GE is marked by the red arrow. The shaded region is introduced in order to focus the attention on the area, where a plasma jet could be produced. Figure 2 shows the typical waveforms of displacement current, discharge current (subtracting the displacement component from the total current), and integrated light emission from the plasma jet, along with the applied voltage (peak voltage 11.6 kV) under different gas flowrates. When the flowrate is set at 0.5 l min−1, it follows from the discharge current waveform in Fig. 2a that several current pulses are irregularly presented in both the positive and negative alternations, with the maximum current peak about 250 mA. An approximately symmetric temporal evolution of discharge current appears in the whole cycle, despite of the asymmetric electrode configuration. Examining the light emission indicates that the plasma jet emits light at each current pulse. As seen from Fig. 2b, with the flowrate increasing to 1.1 l min−1, both the discharge current and light emission exhibit similar temporal evolutions as the case at 0.5 l min−1, except that the maximum current peak increases to about 330 mA. In the two cases, the current pulse width ranges from 150 to 350 ns and the time interval of current pulses remains in the range of 6–12 μs, which is qualified as the typical characteristic of microdischarge consisting of many discharge filaments in the gas gap32. The displacement current is much smaller than the discharge current. For clear observation, the displacement component is enlarged by ten times in Fig. 2a, b. With the applied voltage unvaried, the displacement current has the same temporal evolution at 0.5 l min−1 and 1.1 l min−1. a Typical waveforms of applied voltage (gray solid line), discharge current (dark blue solid line), displacement current (light blue solid line), and integrated light emission (light red solid line) with the gas flowrate fixed at 0.5 l min−1. The displacement component is enlarged by ten times. b Same as a, but with the gas flowrate fixed at 1.1 l min−1. c Typical waveforms of applied voltage (gray solid line), discharge current (dark blue solid line), displacement current (light blue solid line), and integrated light emission (red solid line) with the gas flowrate fixed at 2.2 l min−1. d Same as c, but with the gas flowrate fixed at 7.8 l min−1 and the light emission indicated by the light red solid line. e The enlarged view of the applied voltage (gray solid line) and light emission (red solid line) marked in the gray shadow in the positive alternation at 2.2 l min−1 in c. f The enlarged view of the applied voltage (gray solid line) and light emission (red solid line) marked in the orange shadow in the negative alternation at 2.2 l min−1 in c. The shaded regions are introduced in order to focus the attention on the difference of light emission in the negative alternation from that in the positive alternation. When the flowrate increases to 2.2 l min−1, a great change occurs in the temporal evolution of discharge current, as shown in Fig. 2c. A remarkable feature is that the current pulses only appear in the positive alternation and no pulses are observed in the negative one. The maximum current peak sharply drops to around 30 mA. It is worthy of notice that almost no current components could be distinguished in the negative alternation even though a room was made during the current signal acquisition, which is probably attributed to the detection capacity limitation of the instruments employed in our experiment. But to our surprise, the light emission from the plasma jet could be detected not only in the positive but also in the negative alternation. In the negative alternation, the temporal evolution of light emission follows a ripple-shape, rather than a sharp pulse. To compare the light emissions recorded in the positive and negative alternations clearly, their temporal evolutions marked in the gray and orange shadows are enlarged and shown in Fig. 2e, f, respectively. Although the emission intensity in the negative alternation is much smaller than that in the positive one, its duration occupies a quarter of the cycle (~30 μs) and far exceeds the typical width of light emission pulse (~230 ns). The discharge current changes greatly in comparison with the cases at 0.5 l min−1 and 1.1 l min−1, but the displacement current does not change at all and exhibits the same waveform as shown in Fig. 2a, b. The waveforms of discharge current and light emission for the discharge at 7.8 l min−1 were shown in Fig. 2d. It is found that in comparison with the case at 2.2 l min−1, the peak current in the positive alternation rises to some extent and its maximum nearly increases to 50 mA. Contrastingly, the current pulse is clearly observed once again in the negative alternation and its peak current is comparable to most of the counterparts in the positive alternation. The discharge current waveform indicates that the discharge assumes a typical characteristic of microdischarge. This characteristic is also verified by the light emission examination, where the light emission is observed at each current pulse in the positive and negative alternations, with its pulse width <350 ns. With increasing the gas flowrate, a great change is observed in the discharge current and light emission, but the displacement current remains unvaried all throughout. The morphology of plasma jet were examined under three different gas flowrates, with the results shown in Fig. 3. Figure 3a shows several typical physical appearances of the plasma jet produced at 0.5 l min−1. The images were captured by a digital camera with the exposure time of 10 ms. It is found that the 41 mm long gas gap is occupied by many discharge filaments. To go further into the filaments, a fast intensified charge-coupled device (ICCD) camera was employed to clarify the discharge details. The gate width was 4 μs and the detailed capture strategy can be found in the “Methods” section. For observing the plasma patterns more clearly, the tube profile without discharge is exhibited in Fig. 3d. Figure 3d also shows the images of filaments generated in four random current pulses for both the positive and negative alternations. Significantly, for each current pulse, only one filament is produced in the thin quartz tube. a Typical images of the plasma jet acquired by a digital camera with the gas flowrate fixed at 0.5 l min−1 at four different moments. The plasma jet extends along the z-axis, with its length of 18 mm. The exposure time is 10 ms. b Same as a, but with the gas flowrate fixed at 2.2 l min−1 at four different moments. c Same as a, but with the gas flowrate fixed at 7.8 l min−1 at four different moments. d Typical images of the plasma jet captured by a fast intensified charge-coupled device (ICCD) camera with the gas flowrate fixed at 0.5 l min−1 at four random current pulses for both the positive alternation (PA) and negative alternation (NA), as well as the tube profile without discharge. Images in PA and NA are separated by the red dashed line. The gate width is 4 μs. e Same as d, but with the gas flowrate fixed at 2.2 l min−1 at six random current pulses for both PA and NA. f Same as d, but with the gas flowrate fixed at 7.8 l min−1 at four random current pulses for both PA and NA. g Plots (purple solid circle) of the plasma jet length as a function of the gas flowrate. Within the flowrate range from 2.2 to 7.8 l min−1, the plots show an average of five experimental measurements, and the measurement uncertainty (one standard deviation) is indicated by the error bars and is estimated to be 5–7%. The shaded regions are introduced in order to focus the attention on the variation of discharge mode with the gas flowrate, i.e., gray shadow for the filamentary discharge, green shadow for the diffuse discharge, orange shadow for the mixing mode of filamentary and diffuse discharge, and red shadow for the discharge interruption. h Spatial distributions of light intensity of discharge along the transverse direction at the distance of 1 mm away from the nozzle for the gas flowrates of 0.5 l min−1 (black dotted line), 2.2 l min−1 (red solid line), and 7.8 l min−1 (blue dashed line). The origin is set at the center of the quartz tube. Figure 3b shows the plasma jet generated at the gas flowrate of 2.2 l min−1. It is obviously observed that the discharge transforms from the filamentary regime into the diffuse mode and the visible region of the plasma jet extends downstream only about 8 mm away from the nozzle. The stability of the diffuse plasma was verified by monitoring of the plasma jet continuously working for several hours without mode transition. To further identify the diffuse feature of the plasma jet, ICCD images were taken with the gate width of 4 μs (much less than the duration of light emission in the negative alternation), with the results shown in Fig. 3e. It is seen that even for the random narrow current pulses in the positive alternation, the quartz tube is filled with diffuse plasma, rather than the filament. This feature is quite different from the traditional filamentary DBDs, where the random narrow current pulse is always accompanied by the luminous filaments32. |


